Ashwin Raj

I am a student in the M.S. in Human Language Technology program at the University of Arizona. I am a student employee at Tech Launch Arizona, working as a Market Research Associate. I did my internship this summer with Tech Launch Arizona. This page serves as the report of the work I have accomplished.

Tech Launch Arizona

Tech Launch Arizona teams with university faculty, administration, students, alumni, in concert with the technology and business community, to maximize the impact of UArizona research, intellectual property (IP) and technological innovation.

Introduction

For my Human Language Technology internship, I worked with Tech Launch Arizona, an entrepreneurship affiliate of the University of Arizona. The aim of this internship was to apply the natural language processing tools that I have learned in my classes to a real-world dataset. I wanted to compare some different models of representing text as vectors. The goal was to develop a classification system for categorizing inventions based on their title, description, and background information. Given the diverse range of inventions, automatically classifying them into appropriate categories can significantly streamline processes such as patent filing, market analysis, and intellectual property management. By employing various machine learning models, including Bag of Words, TF-IDF, Naive Bayes, and Logistic Regression, my work aimed to determine the most effective approach for accurately predicting the category of an invention. Additionally, the project involves evaluating the performance of these models to identify the strengths and weaknesses of each approach, ultimately leading to the selection or combination of models that deliver the best results. I also had to turn my findings into a tool that a user could employ to assist in the market research and commercialization assessment process. This classification task is crucial for improving the efficiency and accuracy of managing large datasets of inventions in various domains, and can be a great help when doing market research to help find potential licensees and competing products.

Background of the Data

The data I had to work with came from the Tech Launch Arizona website of inventions. Due to the confidential nature of the inventions and to respect the authors' privacy, I worked solely with the non-confidential summaries of the invention. These contained a brief overview of the invention and a brief background about the invention's use case and benefits. Each invention is also classified into different categories, such as Healthcare Portfolios, Creative Works, etc. Each invention would be a data point - the text fields of the description and background would serve as the x values, and the category would serve as the y value, or label. Currently, each invention has to be manually assigned a category and subcategory. My aim was to create a model that would predict the category based on the description and background.

Data Collection

The initial step in my project involved acquiring a workable dataset from the website hosting the invention data. As a student employee, I did not have access to the structured dataset that TLA uses to populate the inventions website, so I had to use web scraping to gather the data. Since all the data was presented online, I utilized BeautifulSoup, a Python library for web scraping, to extract the HTML content. However, due to the website's dynamic loading behavior, direct scraping proved to be challenging. My approach here was to use the search functionality of the website to return all 1000+ inventions and then scrape the data that way. Since the search function is paginated, I realized I could iterate through the pages and collect the invention data that way. I wanted to see how the html was structured so that I knew what I had to do to grab all the inventions on that page.


Before I implemented the code to grab the inventions page by page, I wanted to first implement the code to extract the necessary information for this text classification task. On each invention page, there is the title of the invention, a description of the invention, some background information, and then the technology classification. I inspected the HTML for a few invention pages and noticed some patterns. For example, the title is always in a header tag called "h1", and the invention and description are always in a division tag called "c_tp_description". I used BeautifulSoup here to find the relevant tags and extract the HTML code. I also had to experiment with some regular expressions (regex) to capture only the relevant text information (and not any unnecessary vestigial html snippets). I ran into some problems here trying to find a consistent method to scrape the necessary text - according to my manager, there was a change in the backend template that is used to update the website a few months ago, causing some slight changes in the html for inventions uploaded after that change. I had to carefully examine and tweak my code to accommodate slight variations in html format.


The next step was to get the list of inventions on each page of the search, as mentioned above. Again using BeautifulSoup, I saw that each invention was its own element and grabbed the hyperlink to the invention. I put all this into a function, get_urls_on_page(page_num), where I could retrieve all inventions on the specified page number.

Now that I had a function to get all the necessary text data from each invention and a function to get all the inventions, it was time to create my dataset that I would do my analysis on. Using pandas, I created a dataframe with each invention being a row, having the features Invention (the title), Description, Background, and Category.

Once I had my data in a csv file, I noticed there were some data points that needed cleaning. For example, there was an issue with the word "This," where there was a non-English character after some occurrences. I used more regular expressions here after skimming the data set to remove any more unwanted patterns and html remnants.

Data Analysis and Model Creation

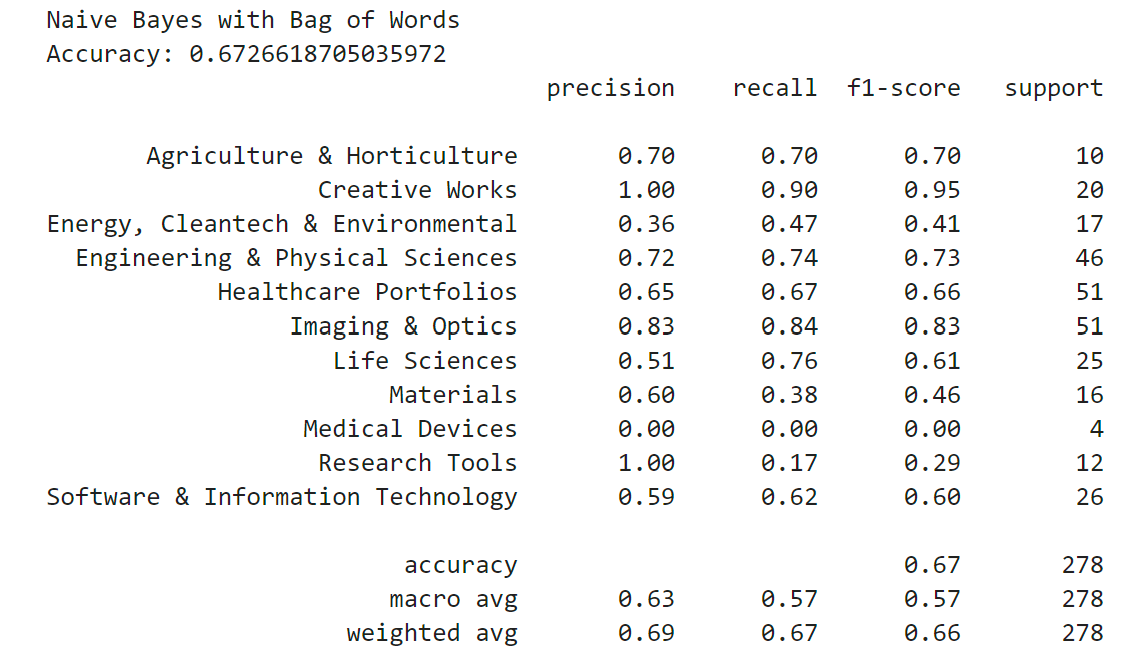
Now that I had my dataset, it was time to start building the different models to test. To build and train these models, I had to convert the text data into a numerical representation that the model can work with. There are several ways to create word vectors, but two common ones are the Bag-Of-Words model and the term frequency-inverse document frequency (tf-idf) model. I first split the data into training and test sets so that each model could be trained on the data and tested on its accuracy. The first word embedding I used was the Bag of Words model. This model represents text as an unordered collection of words. This model does not take into account word order, it just uses the frequency of the word as a feature. To do this, I used the CountVectorizer tool from scikit-learn. This transforms a given text into a vector based on the frequency of each word. I also chose the parameters to remove stop words from the data, which are commonly used words that do not provide significant meaning to the data.

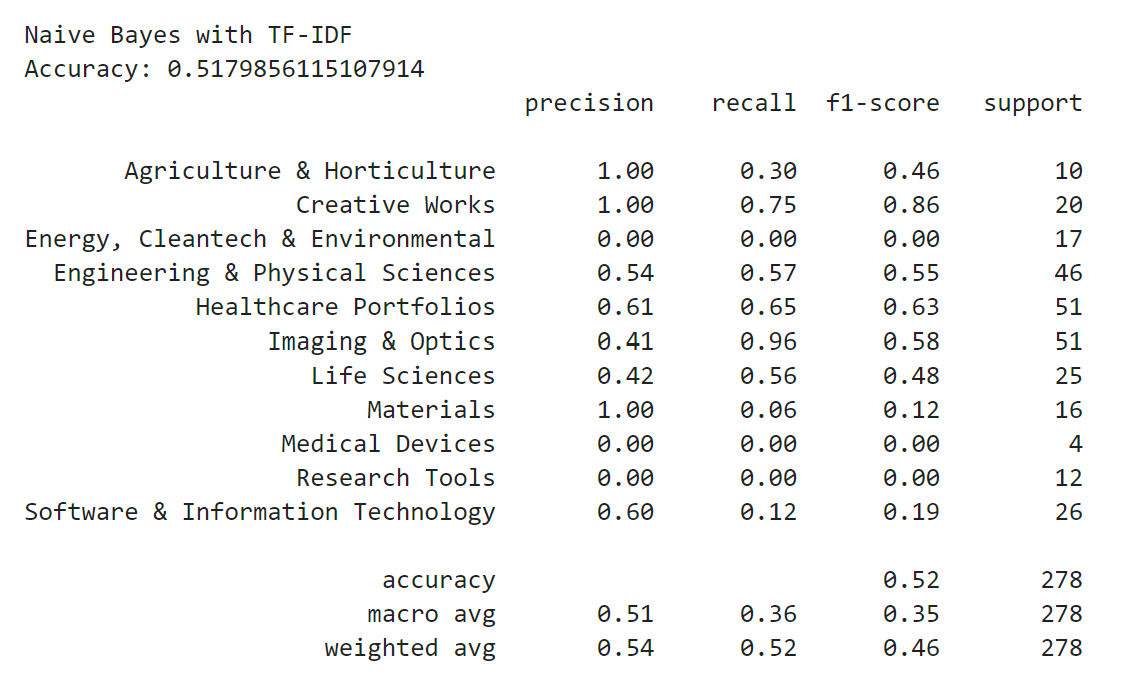
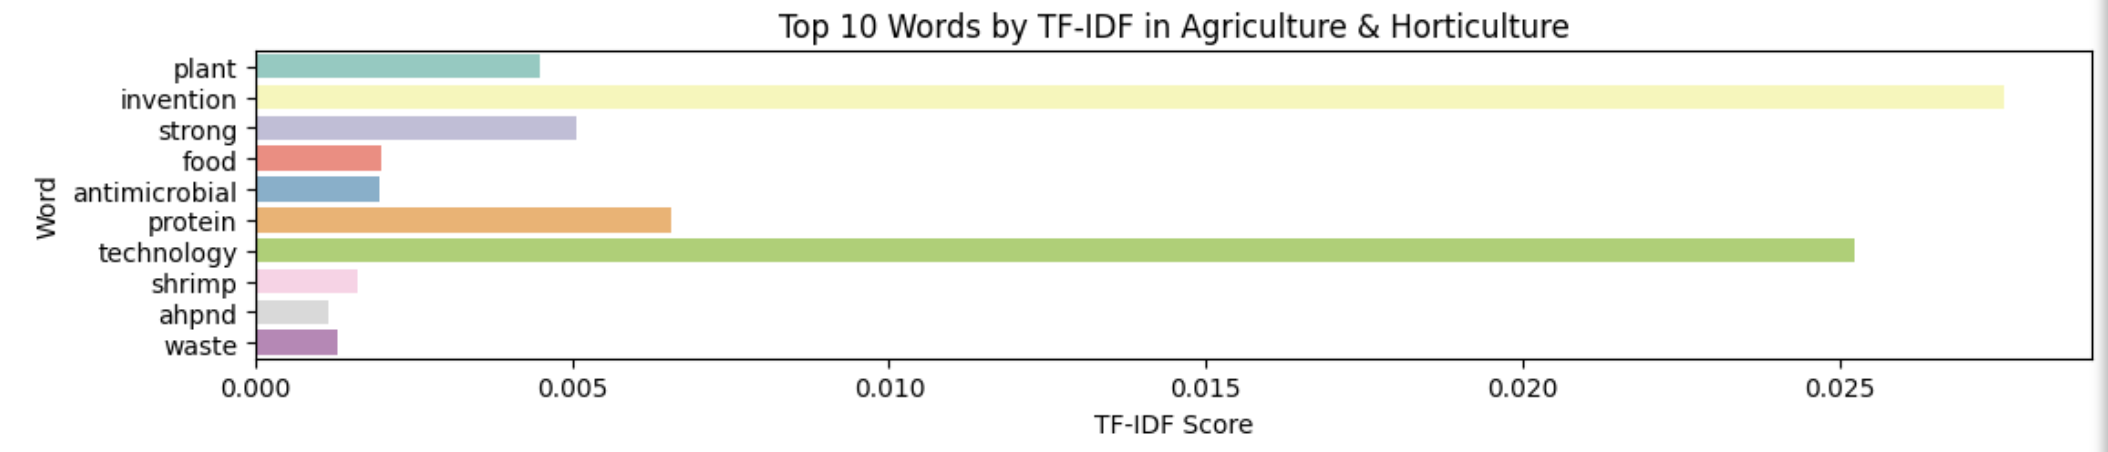
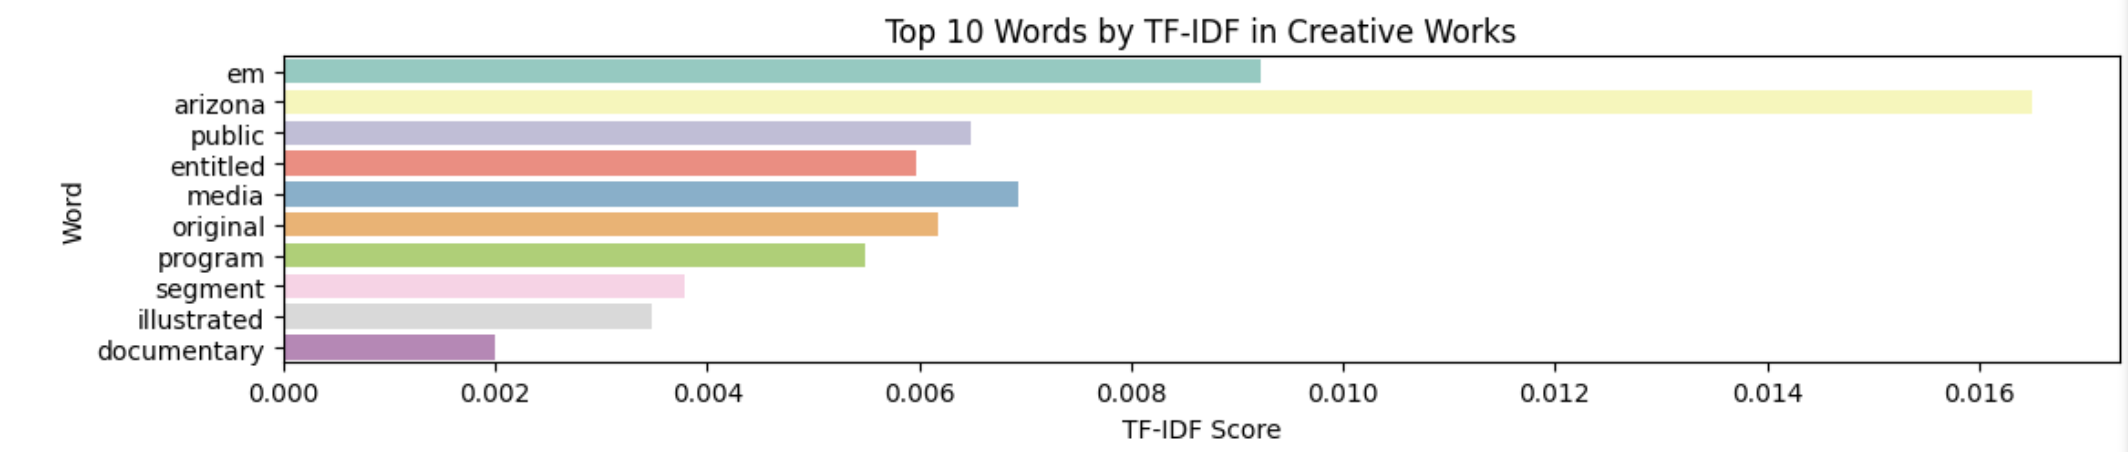
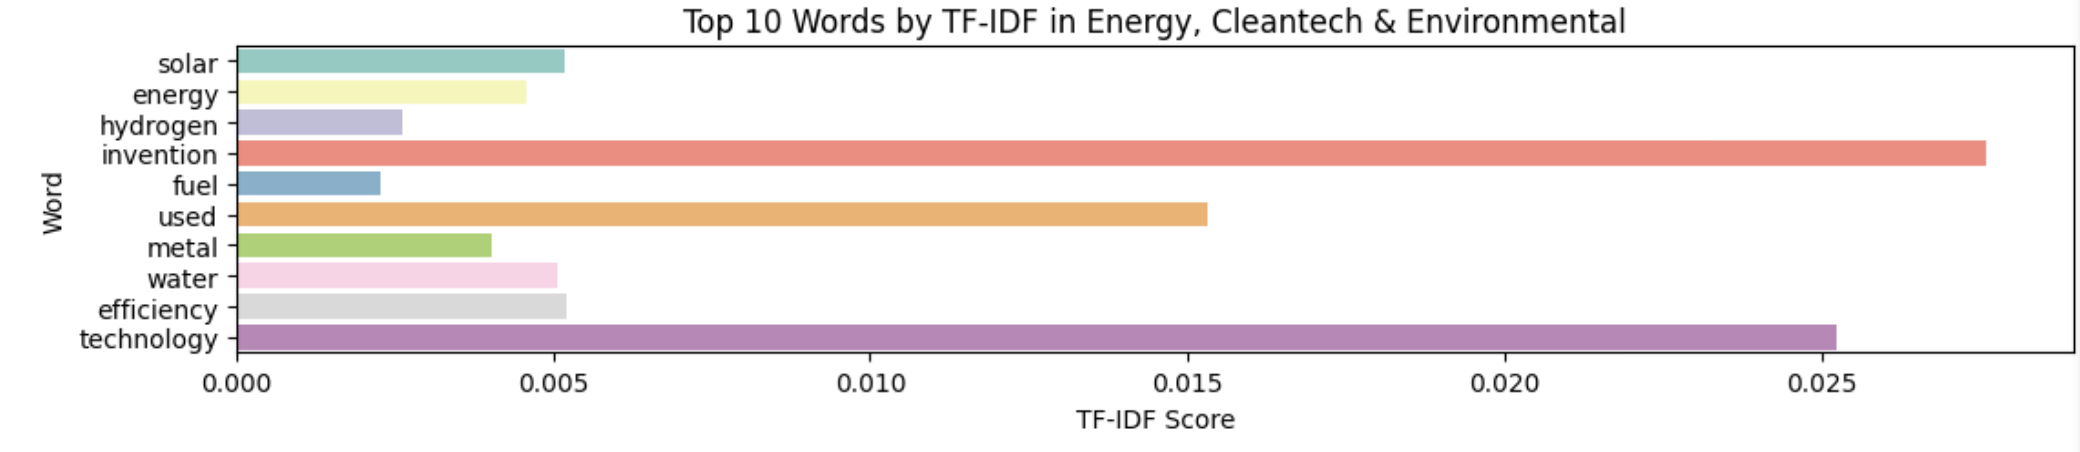
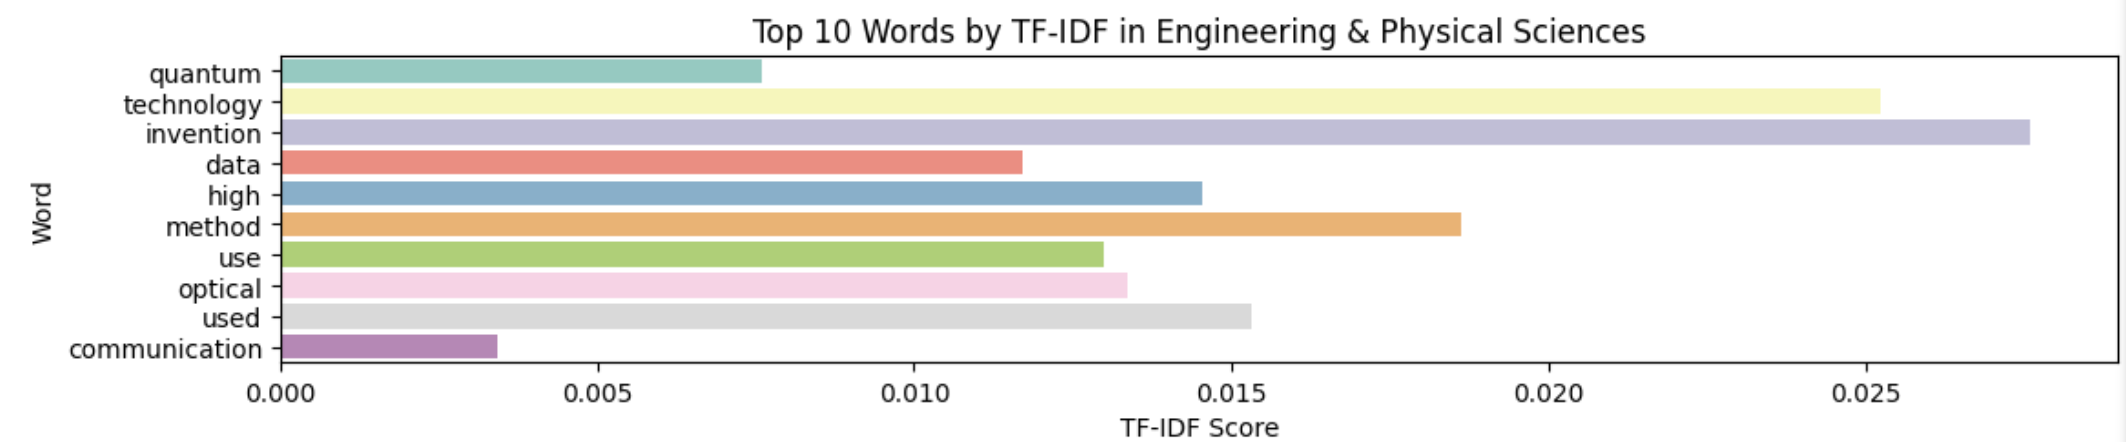
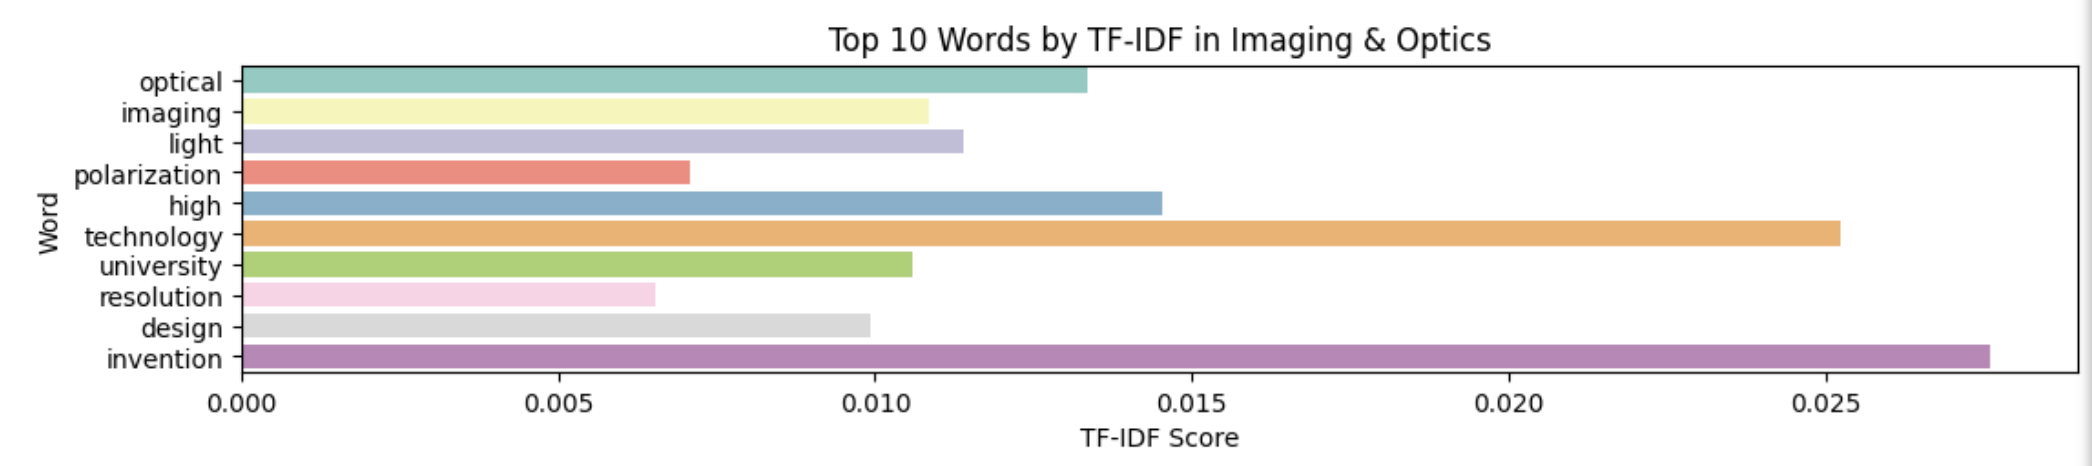
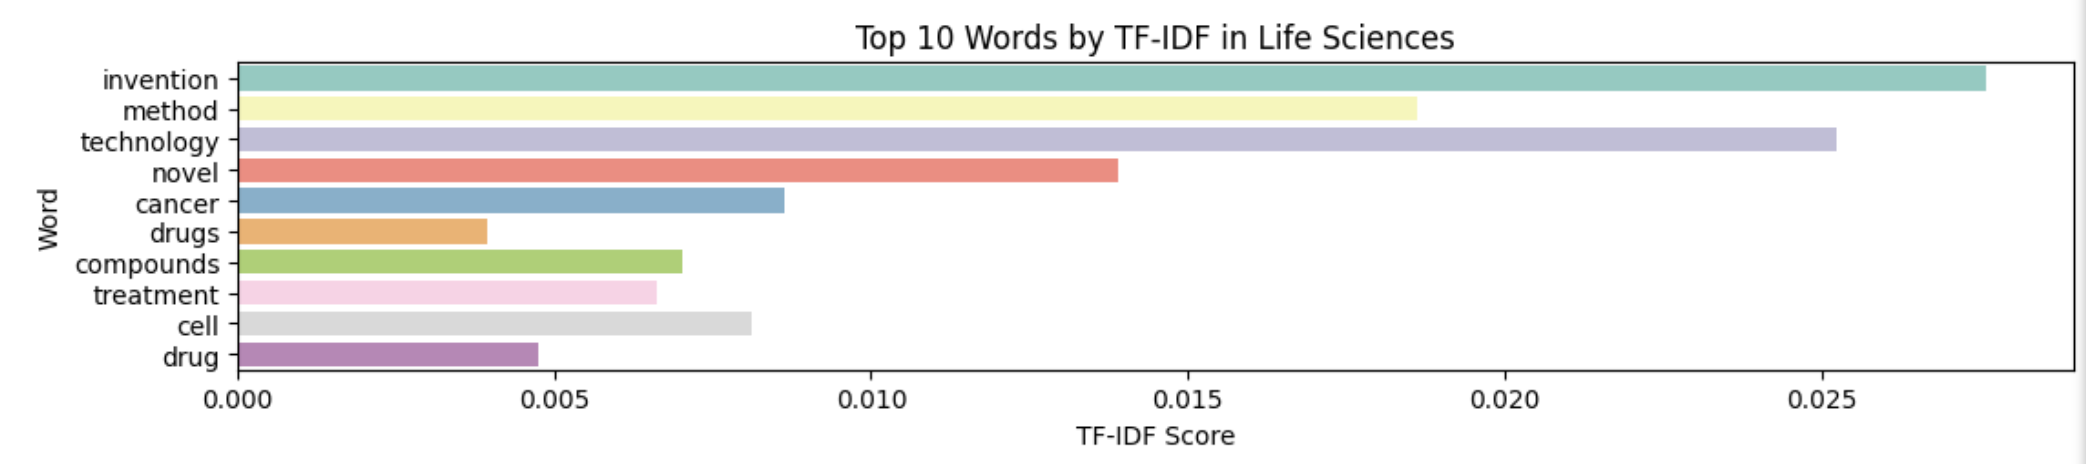
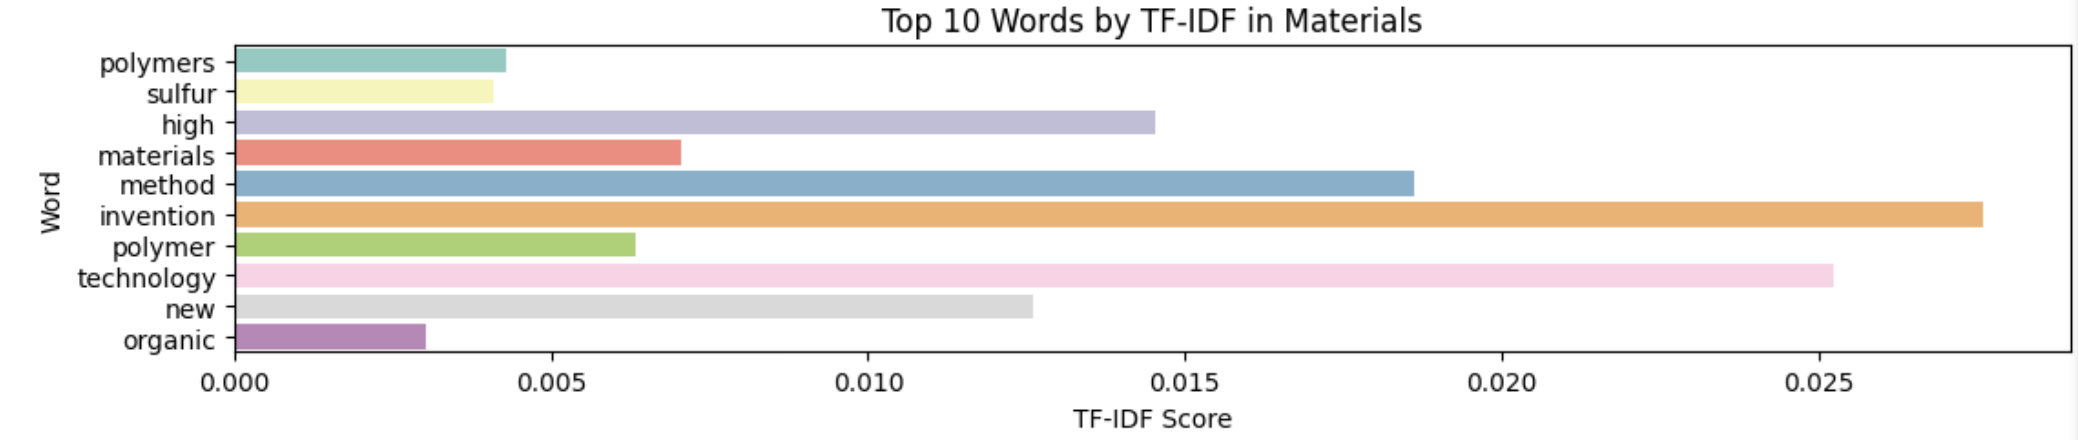
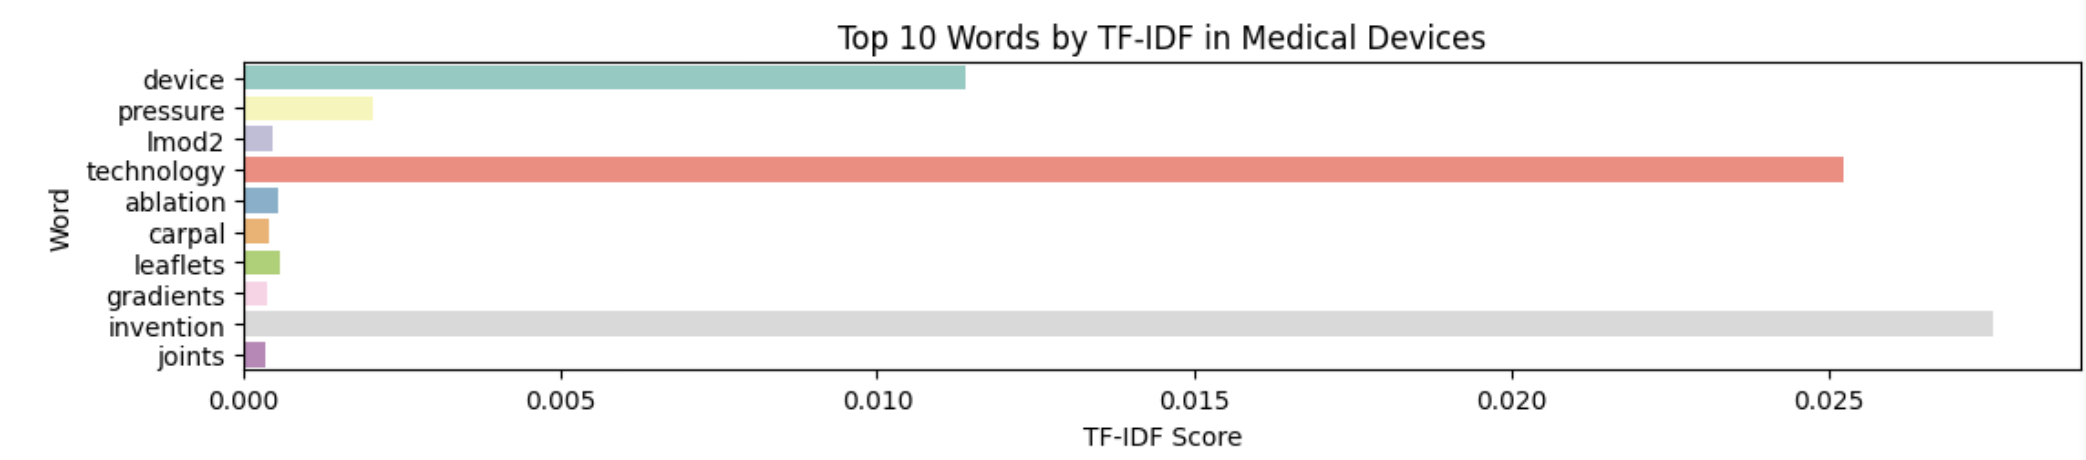
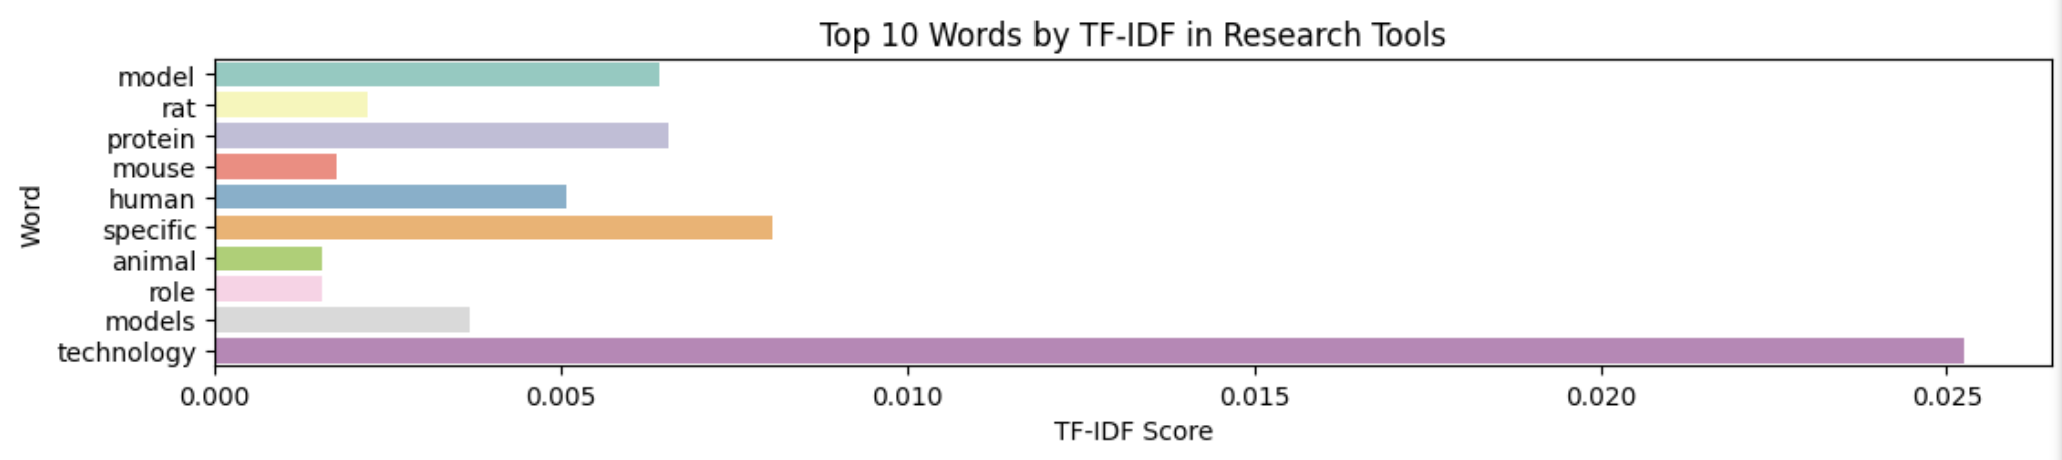
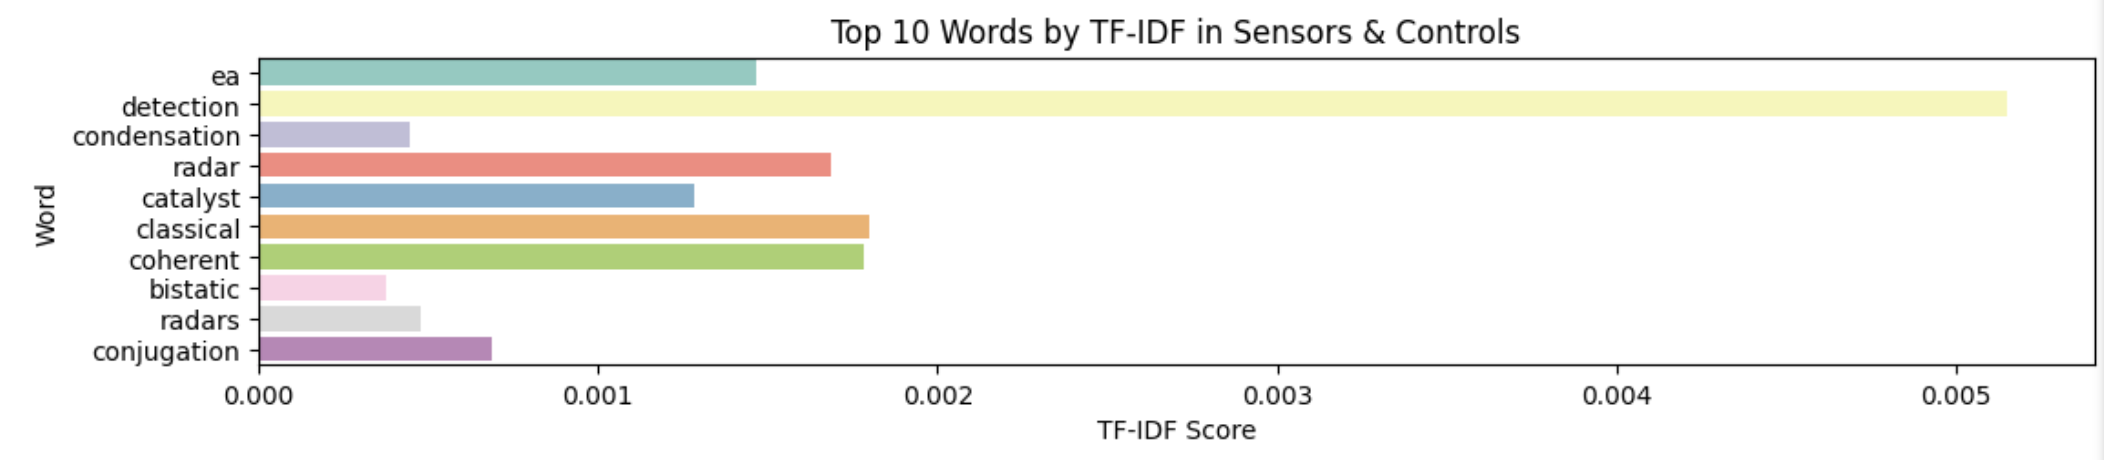
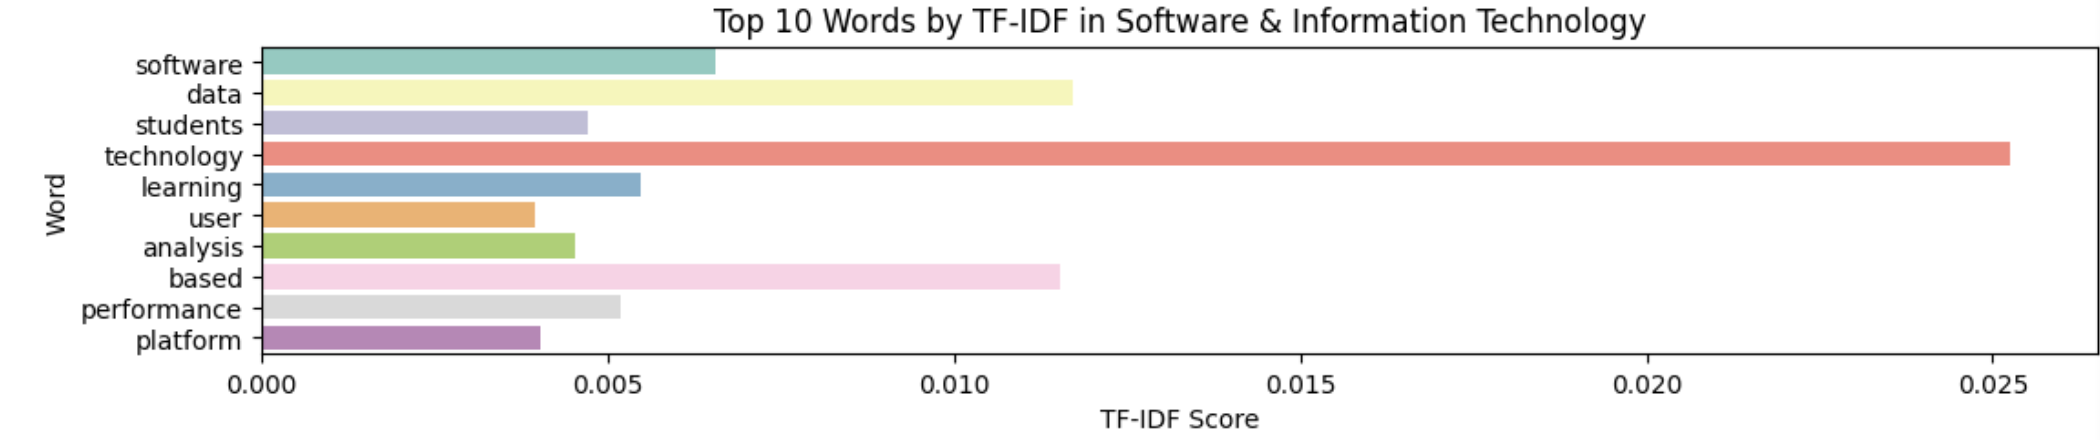
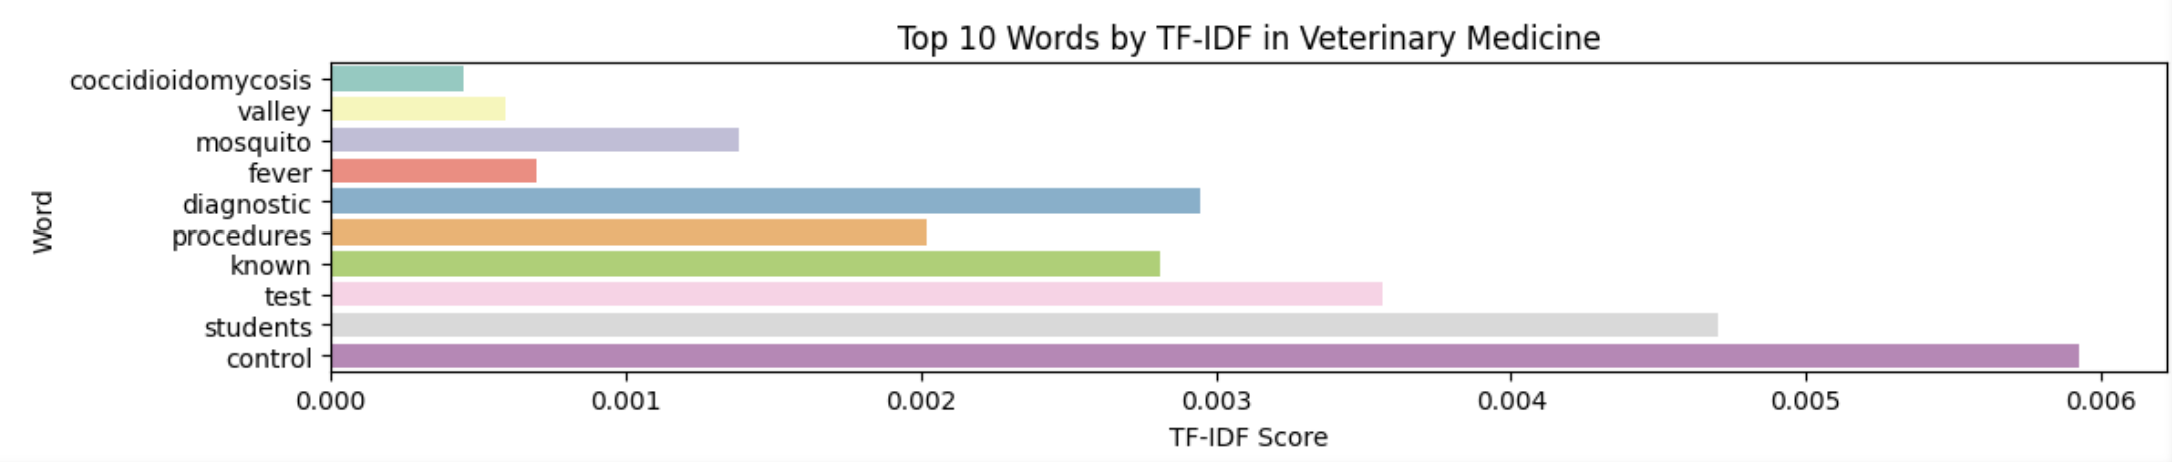
The next word-embedding model I used was the tf-idf model. This model is better at ignoring common words and places more importance to rarer words. Unlike Bag of Words, it assigns weights to words based on their importance in the document and corpus. I used the TfIdfVectorizer tool from scikit-learn to create this model, again filtering out stop words.

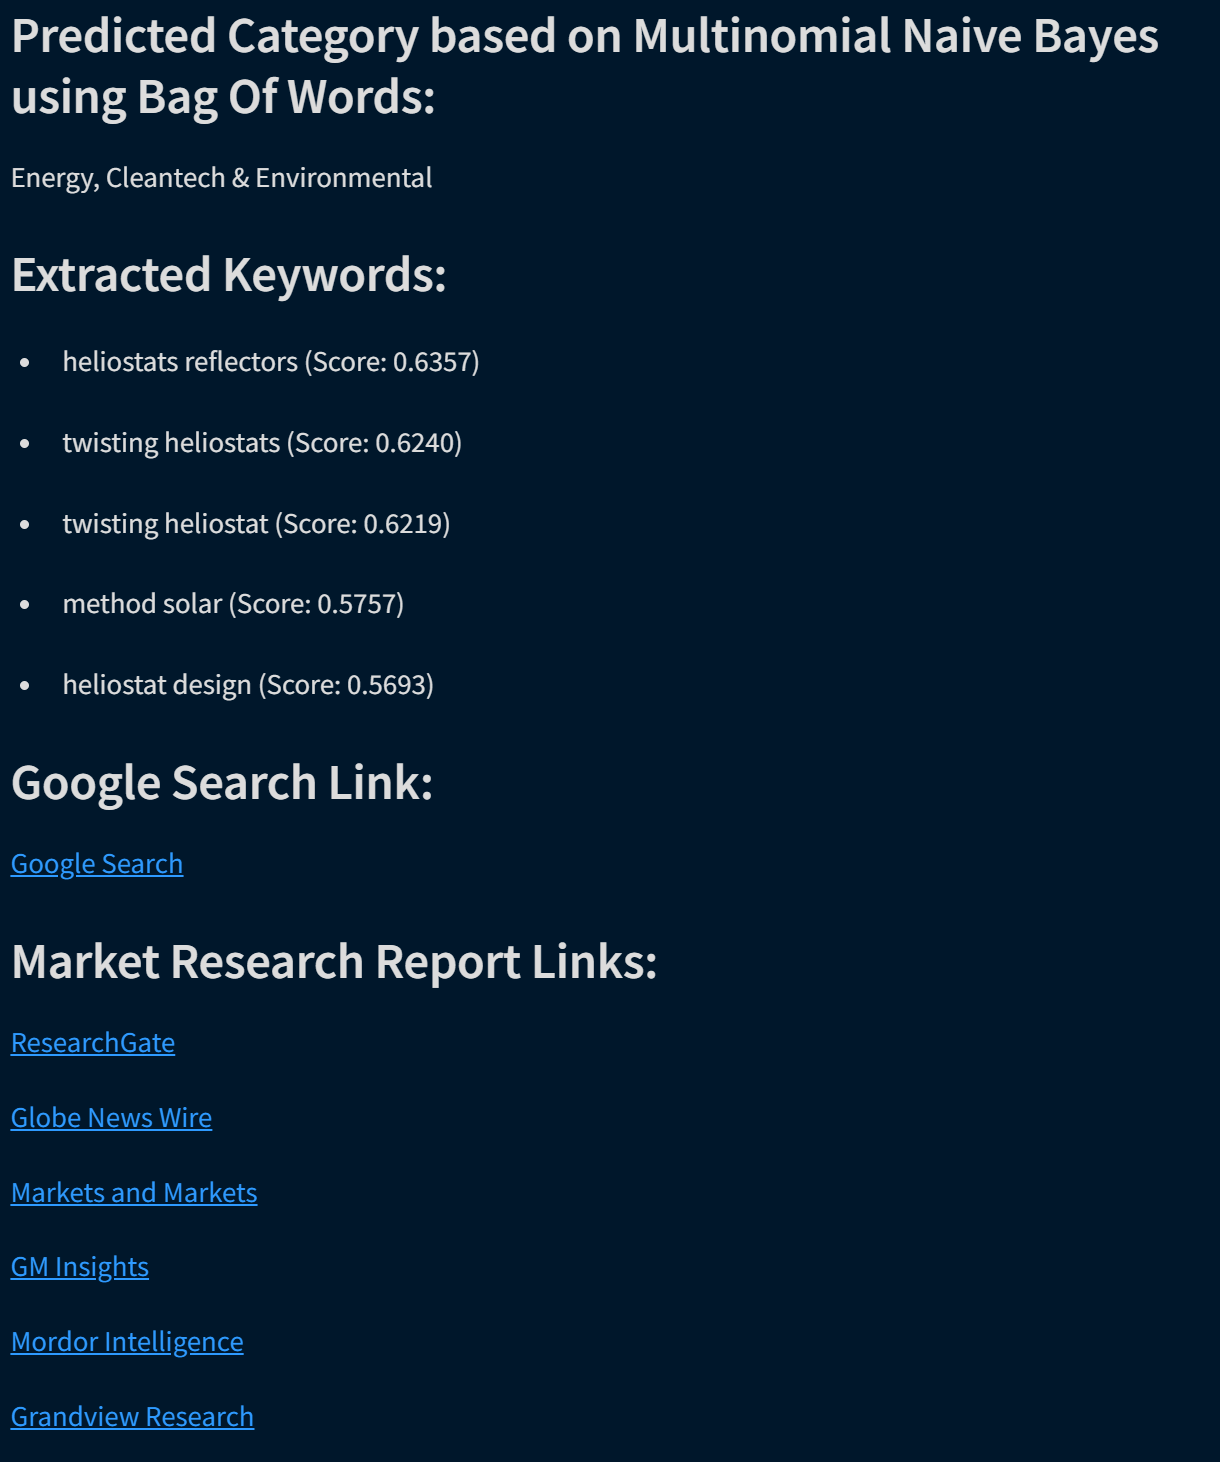
Now that I had two different numerical representations of the text data, I could compare different classifier models. The first model I wanted to test was Naive Bayes. Naive Bayes is a probabilistic classifier that assumes independence and uses conditional probabilities to find the probability of a class for a given data point. I fit the bag-of-words feature data on one multinomial Naive Bayes model and I fit the tf-idf feature data on another multinomial Naive Bayes model.

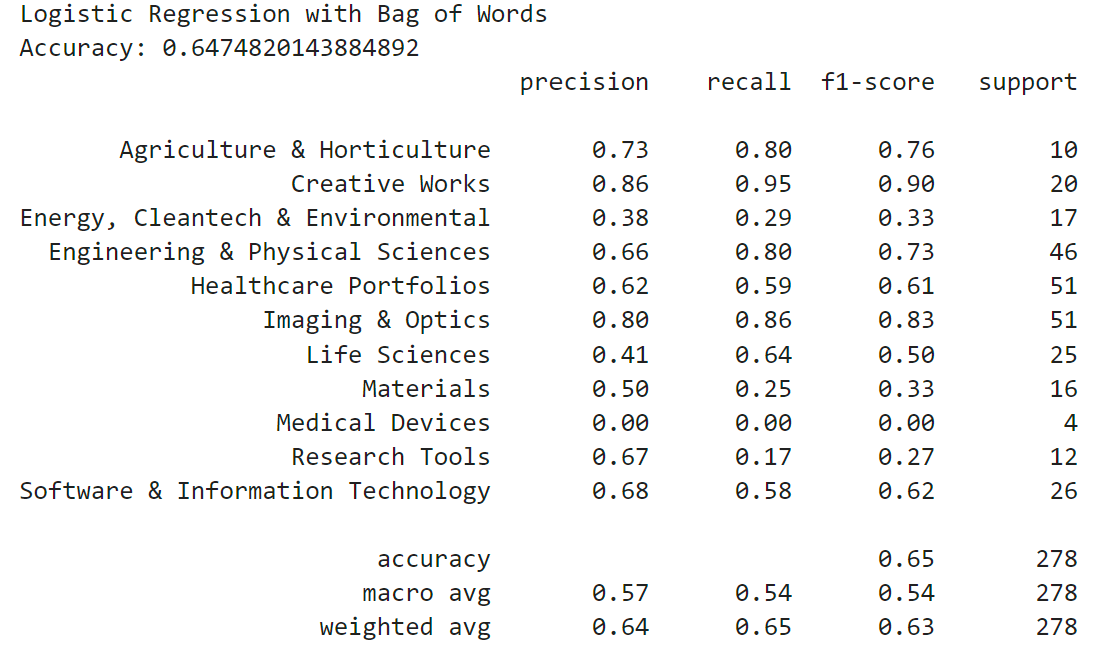
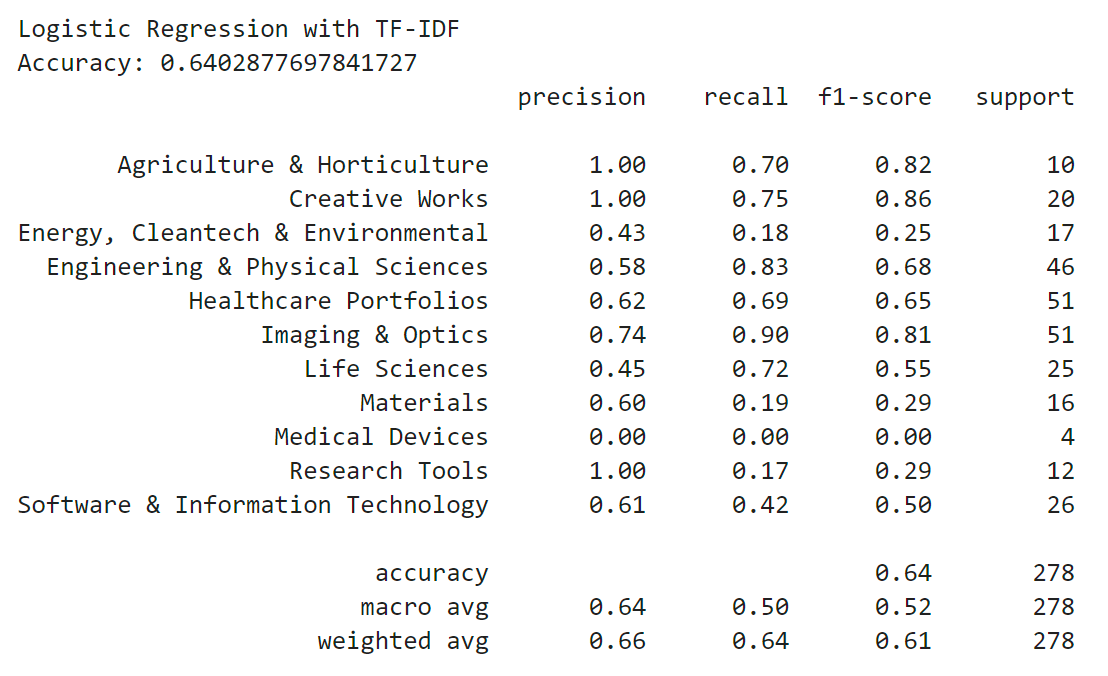
I wanted to compare the Naive Bayes model with a logistic regression model. Naive Bayes is a generative model and estimates the probability of each class based on Bayes' Law to predict the label for a data point, whereas logistic regression is a discriminative model that uses the logistic function to map data points to labels. Logistic regression tends to perform better at more complex text classification tasks. Like before, I fit the bag-of-words feature data on one logistic regression model and I fit the tf-idf feature data on another logistic regression model.

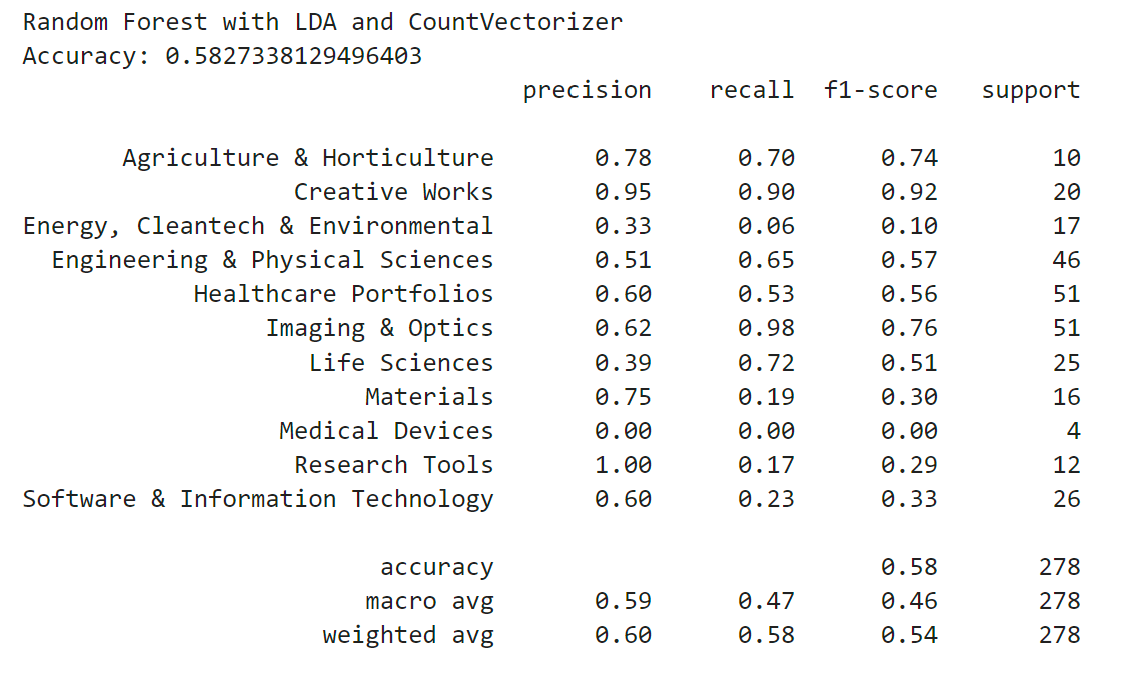
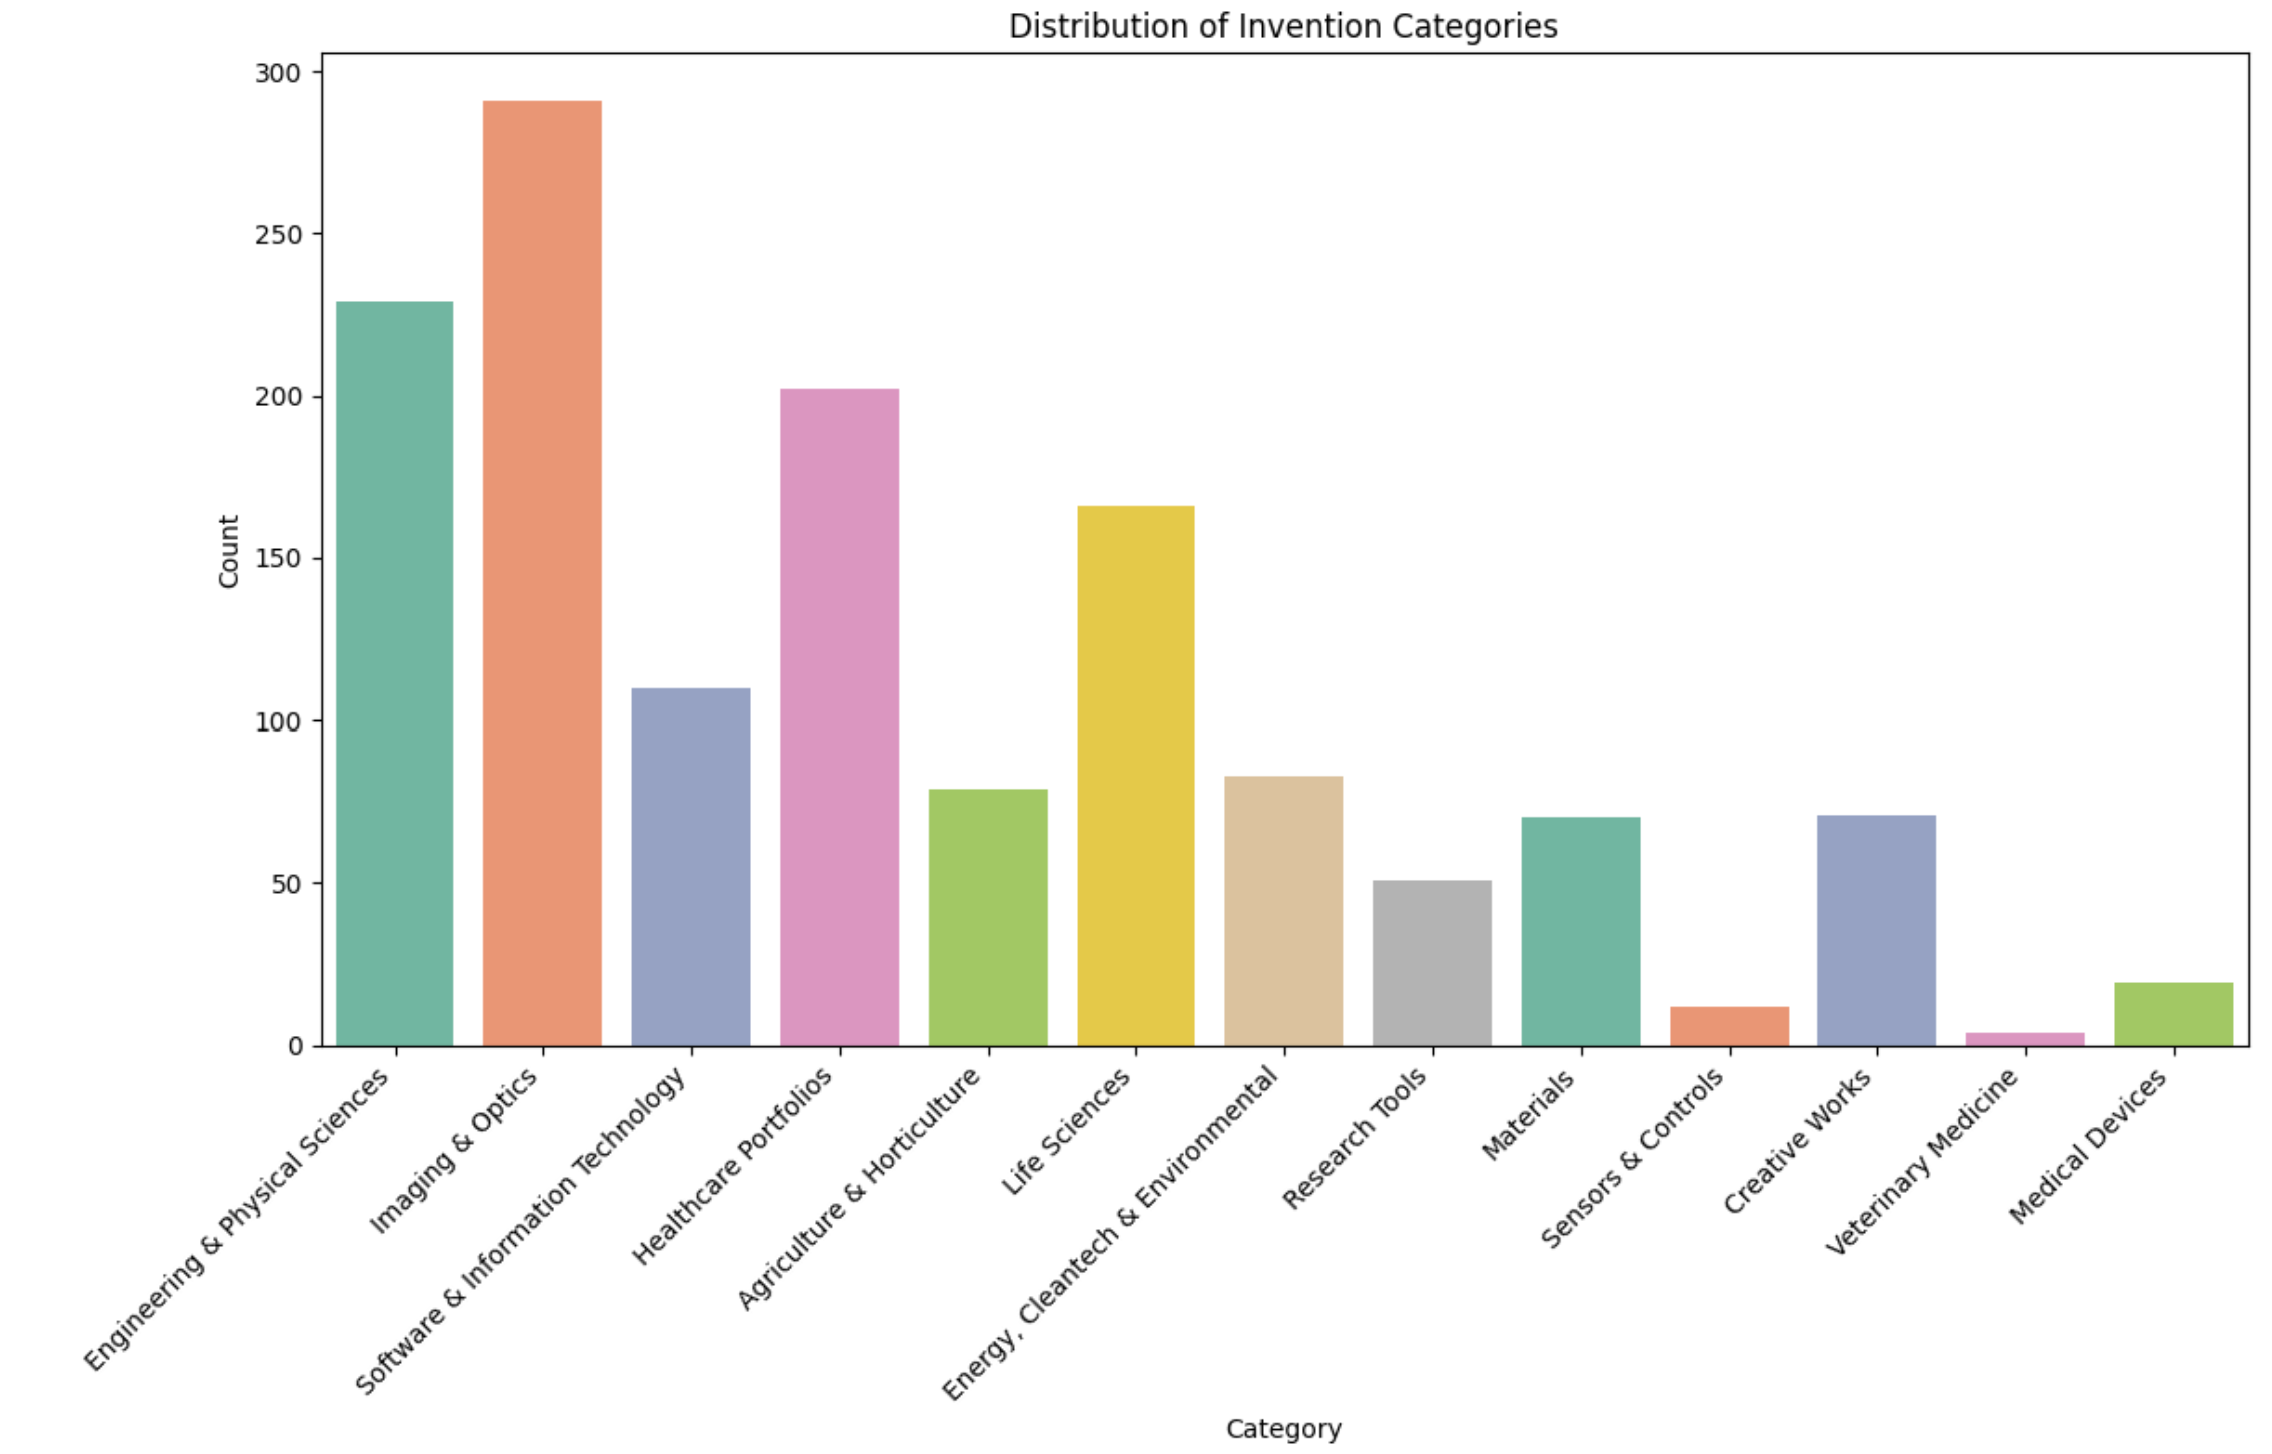
Next I wanted to test a more advanced algorithm, Latent Dirichlet Allocation (LDA). LDA is a generative model based on the bag-of-words model. LDA is a topic modeling algorithm that is used for discovering topics in a piece of text. I used the module from scikit-learn and applied the bag-of-words data to the model with a value of 13 topics (the number of potential categories the invention could be classified as).

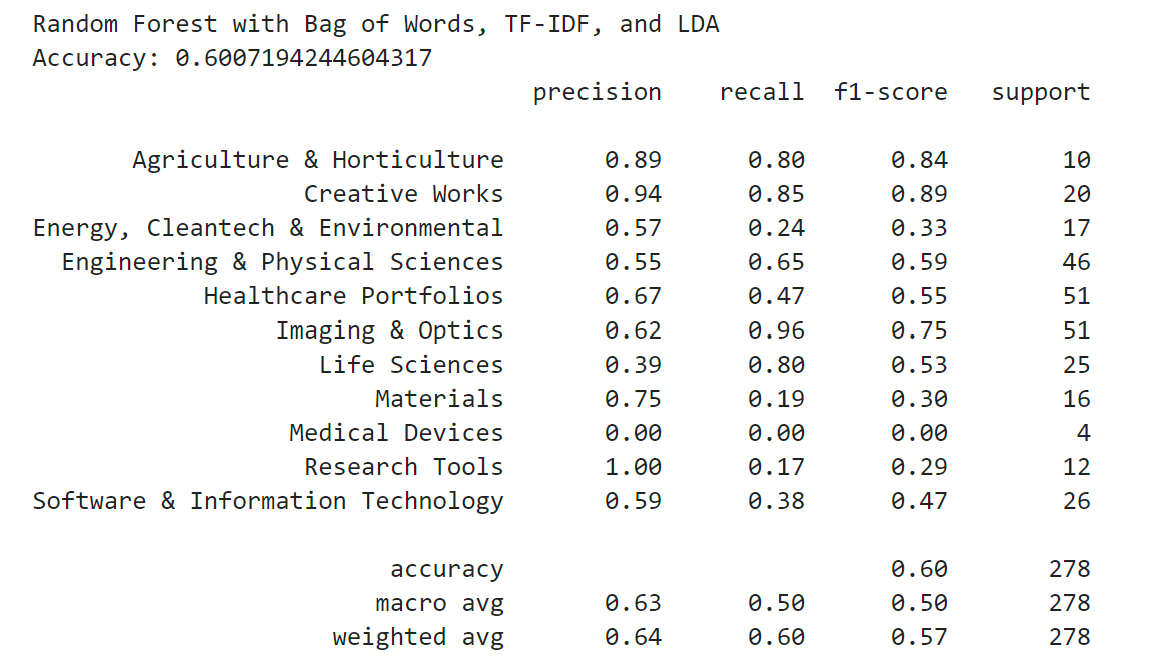
Finally, I wanted to combine the bag-of-words features, the tf-idf features, and the LDA model to see if this would result in the best accuracy. I vectorized the data using CountVectorizer for bag-of-words and TfidfVectorizer for tf-idf. I then created the LDA model as before, but then combined the feature vectors column-wise to create a final combined feature vector for each data point.

Results

The accuracy for each model that I tested is as follows:

Naive Bayes with Bag-Of-Words: 67.3%

Naive Bayes with Tf-Idf: 51.8%

Logistic Regression with Bag-Of-Words: 64.7%

Logistic Regression with Tf-Idf: 64.0%

Latent Dirichlet Allocation: 58.3%

Bag-Of-Words, Tf-Idf, and LDA combined model: 60.1%

The tables for all these models were created using scikit-learn's classification report tool. It prints out a precision score, a recall score, an f1 score for each of the labels, and an overall accuracy score. These metrics all have to do with true and false positives and negatives and can shed light on the performance of a model. Precision is the proportion of all the model's positive classifications that are actually correct. The equation is TP / (TP + FP), where TP and FP are true positives and false positives. Recall is the proportion of all actual positives that were classified correctly as positives. The equation is TP / (TP + FN), where FN is false negatives. The accuracy and F1 score are both metrics that take into account both. The F1 score takes into account how the data is distributed, while the accuracy is simply the measure of all the correctly identified cases.

Based solely on the accuracy metric, the Naive Bayes model with the Bag-Of-Words word vector representation had the highest accuracy on the test data. Naive Bayes works well with sparse, high-dimensional feature data which are often produced by bag-of-words models. Bag of Words captures the frequency of words without weighing them based on importance, so this approach may be better suited for the invention data. It might be that Bag of Words outperformed Tf-Idf because the most frequent words were also the most predictive of categories. There was an interesting performance gap in the results: there was nearly a 20% difference in accuracy between the two Naive Bayes models (one with bag-of-words, one with tf-idf), while the two logistic regression models differed in accuracy by less than 1%. It may be that with a larger dataset, the two Naive Bayes models may converge to a lower accuracy than the two logistic regression models, as logistic regression is considered to be the more robust model between the two. The logistic regression models may have overfit the training data (which consisted of roughly 1200 data points) and thus underperformed. It was interesting that a more advanced model, the LDA model, performed poorly compared to Naive Bayes and Logistic Regression. This suggests that LDA, which is a topic modeling technique that finds abstract topics within documents, may not align perfectly with classifying text into predefined categories.

Data Visualization

I wanted to perform some data visualization on the dataset to see the distribution of the different invention categories. Below is the bar plot of the frequency of each of the categories.

Imaging and Optics was the most common category in this dataset, whereas the count of Sensors & Controls and Veterinary Medicine inventions was relatively much more infrequent. This uneven distribution is something to note when analyzing model performance. With so few data points to train on in these infrequent categories, the model may not be as good as predicting test data on these compared to more common invention categories.

I also wanted to see what the most relevant words were for each invention category. This gives some insight in what a model uses to determine the category. I used a tf-idf model to display the top ten words based on tf-idf score for each category. The tf-idf scores were taken from this corpus of invention data.

From these graphs, we can see that certain words are present in many of the categories such as "invention," "technology," and "method." These do not give significant information towards the category, but the more field-specific terms are the ones that are relevant. One thing to note about some of the terms that pop up are that oftentimes, related inventions are uploaded to the website sequentially, so in this ~1200 item dataset, if there were a few inventions about very similar content matter (which can be the case for slightly different applications of a certain technology), the frequency of some of these terms would be biased.

User-Friendly Tool

The last step for my internship was to package everything together into a user-friendly tool that could be used in the market research and commercialization assessment process. For this, I used Streamlit to host an app. The app prompts for an invention title, description, and background.

The app uses the Naive Bayes model with Bag-Of-Words embedding, the model that yielded the highest accuracy, to take this text data and predict an invention category.

I also wanted this app to be able to assist in the commercialization assessment process. To do this, I used a keyword extraction module called KeyBERT. It uses BERT word embeddings and cosine similarity to determine which sub-phrases in a text best characterize the whole document. I experimented with the ngram range and number of keywords returned that could give an accurate and concise query, and found an ngram range of 2 to be sufficient.

I examined the search functionality URLs for Google and several of the market research websites I frequent for writing the CAR reports, and used the query generated by keyword extraction to search these websites. My goal was to ease the market research process by having this tool return some potentially relevant market overviews, market news, and publications based on the invention keywords.

The app can be interacted with here: Streamlit App Link

Future Improvements

The final model I used had a 67.3% accuracy. While this was the highest out of the models I tested, a larger dataset would also help with having more data points on the more infrequent invention categories such as Veterinary Medicine and Sensors & Controls. This was the biggest limitation of the dataset, as accurate models require large amounts of test data that should have representation for all the categories they analyze. I think with combining some more complex models (like neural networks or transformers) and word embeddings, and some advanced feature engineering, a model with an even higher accuracy can be attained.

Additionally, I did not include the subcategories into which each invention is categorized in the final model labels. I found that with the size of my dataset, there would not be enough data to sufficiently train a model to accurately classify into these subcategories. However, with a larger dataset, I believe there is room for future research to see whether Naive Bayes and Bag Of Words is indeed the most accurate model when accounting for the increased number of class labels.

I did experiment with feature engineering by tokenizing the text data and checking for word length, named entity recognition, and punctuation, but each of the models ended up being less accurate than if I did not include these features, so I omitted them in my final analysis.

Improvements in these areas would be interesting for future research to streamline the invention licensing process.

Code

My GitHub repository with my code and data can be found here: GitHub Repository